#9 Data Portrait
Design Process
My data portrait tracks my stress level for 7 days. There are 6 different levels of stress and I make the judgement based on how I feel overall for each day. I noticed that lately I'm feeling more stressed and I wanted to begin to monitor in with the hopes that I can do a better job taking care of my mental state. I also tracked the hours of sleep I received eachd ay because I know that rest and stress are correlated.
Reading Instructions
By tracking the line that moves up and down on the canvas the viewer will be able to determine the level of stressof that day. Also the number of purople circles on the left end of the line determine the amount of sleep for that day. Additionally I added smileys to correspond to the stress levels. Finally I added a BLENDMODE cover to the canvas who's progress was triggered by a SetInterval() function and represented the passing hours of the day.
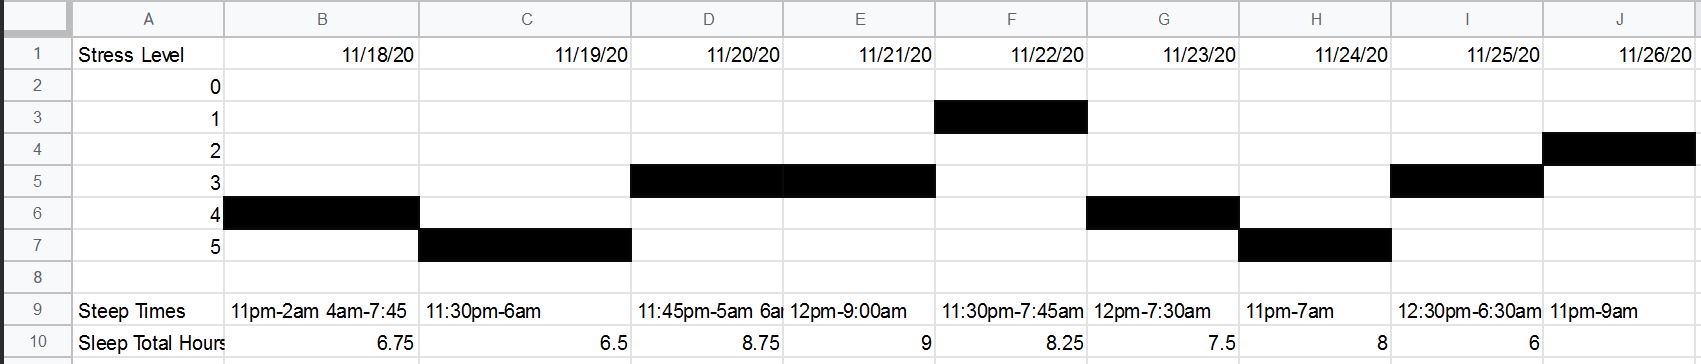
Initially I wanted the levels of stress to be displayed as waves to represent the constant fluctuation. After utilizing a method which allowed me to move the circles to the correct spot I decided to add the smieleys so the uviewer would have a better idea of what they were seeing. In my opinion, adding the shade was an affective way of indicating the passing of time.
Reflection
I confirmed that I'm stressed out most of the time and I need to set up strageties to curb this. Although I know this is necessary it's unforseeable for the near future so I'm not really sure what to do. I think visualizing the data has allowed me to have a better understanding of the situation.